Saturday, December 2, 2017

My favorite software engineering books

The programming books that I find most interesting are neither about computer science theory nor the latest technology fads. Instead they are about the thought process behind building software and the best practices for doing so.

Here are some of my favorite books on software engineering topics:

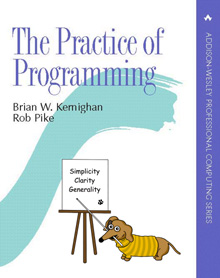
The Practice of Programming

The Practice of Programming is a great round-trip through the struggle of writing programs. It covers many aspects that come together when writing software, like design, algorithms, coding style, and testing. Especially useful early on in your programming journey as an overview of challenges that you'll face.

Programming Pearls

Programming Pearls is a collection of essays by Jon Bentley from Communications of the Association for Computing Machinery. There are "Aha!" moments throughout the essays as they discuss how to analyze problems and come up with good solutions.

Bonus link: if you enjoy the problem solving in this book, then check out Hacker's Delight for clever problem solving and optimizations using bit-twiddling.

The Pragmatic Programmer

The Pragmatic Programmer covers the mindset of systematic and mindful software development. It goes beyond best practices and explains key qualities and trade-offs in programming. Thinking about these issues allow you to customize your approach to software development and produce better programs.

Code Complete

Code Complete is a survey of programming best practices. It draws on research evidence on code quality and provides guidelines on coding style. A great book if you're thinking about how to improve the quality, clarity, and maintainability of your programs.

Applying UML and Patterns

Applying UML and Patterns helped me learn to break down requirements and come up with software designs. This is a great book to help you get past the stage where programs you write from scratch are unmaintainable spaghetti code. I don't know how well this book has aged and would probably ignore the details of UML and Use Cases but the essence remains valuable.

Bonus link: if this book helps you design programs from scratch, then Refactoring will help you recognize that software is "soft" and can be changed substantially in a safe way by following a disciplined approach.

Writing Secure Code

Writing Secure Code discusses software security and the various classes of bugs that lead to security holes. Security is essential for writing code because the majority of programs have a security boundary where they process untrusted inputs. It's important to have a background in security as well as language and technology specifics of secure coding.

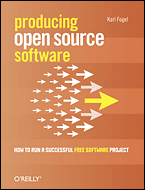
Producing Open Source Software

Producing Open Source Software explains how open source projects and communities work. It covers topics like licenses, project governance, source control, code review, and more. If you are getting contributing to open source or considering running an open source project then this book will prepare you.

Conclusion

These books all contributed to how I think about software development. Let me know which practical programming books you like in the comments!

Wednesday, November 15, 2017

Video and slides available for "Applying Polling Techniques to QEMU: Reducing virtio-blk I/O Latency"

At KVM Forum 2017 I gave a talk about the AioContext polling optimization that was merged in QEMU 2.9. It reduces latency for virtio-blk and virtio-scsi devices with the iothread= option on high IOPS devices like recent NVMe PCIe SSDs drives. It increases performance for latency-sensitive workloads and has been designed to avoid interfering with workloads that do not benefit from polling thanks to a self-tuning algorithm.

The video of the talk is now available:

The slides are available here (PDF).

Monday, November 13, 2017

Common disk benchmarking mistakes

Collecting benchmark results is the first step to solving disk I/O performance problems. Unfortunately, many bug reports and performance investigations fall down at the first step because bogus benchmark data is collected. This post explains common mistakes when running disk I/O benchmarks.

Disk I/O patterns

Skip this section if you are already familiar with these terms. Before we begin, it is important to understand the different I/O patterns and how they are used in benchmarking.

Sequential vs random I/O is the access pattern in which data is read or written. Sequential I/O is in-order data access commonly found in workloads like streaming multimedia or writing log files. Random I/O is access of non-adjacent data commonly found when accessing many small files or on systems running multiple applications that access the disk at the same time. It is easy to prefetch sequential I/O so both disk read caches and operating system page caches may keep the next piece of data ready even before it is accessed. Random I/O does not offer opportunities for prefetching and is therefore a harder access pattern to optimize.

Block or request size is the amount of data transferred by a single access. Small request sizes are 512B through 4 KB, large request sizes are 64 KB through 128 KB, while very large request sizes could be 1 MB (although the maximum allowed request size ultimately depends on the hardware). Fewer requests are needed to transfer the same amount of data when the request size is larger. Therefore, throughput is usually higher at larger request sizes because less per-request overhead is incurred for the same amount of data.

Read vs write is the request type that determines whether data is transferred to or from the storage medium. Reads can be completed cheaply if data is already in the disk read cache and, failing that, the access time depends on the storage medium. Traditional spinning disks have significant average seek times in the range of 4-15 milliseconds, depending on the drive, when the head is not positioned in the read location, while solid-state storage devices might just take on the order of 10 microseconds. Writes can be completed cheaply by leaving data in the disk write cache unless the cache is full or the cache is disabled.

Queue depth is the number of in-flight I/O requests at a given time. Latency-sensitive workloads submit one request and wait for it to complete before submitting the next request. This is queue depth 1. Parallel workloads submit many requests without waiting for earlier requests to complete first. The maximum queue depth depends on the hardware with 64 being a common number. Maximum throughput is usually achieved when queue depth is fairly high because the disk can keep busy without waiting for the next request to be submitted and it may optimize the order in which requests are processed.

Random reads are a good way to force storage medium access and minimize cache hit rates. Sequentual reads are a good way to maximize cache hit rates. Which I/O pattern is appropriate depends on your goals.

Real-life workloads are usually a mixture of sequential vs random, block sizes, reads vs writes, and the queue depth may vary over time. It is simplest to benchmark a specific I/O pattern in isolation but benchmark tools can also be configured to produce mixed I/O patterns like 70% reads/30% writes. The goal when configuring a benchmark is to produce the I/O pattern that is critical for real-life workload performance.

1. Use a real benchmarking tool

It is often tempting to use file utilities instead of real benchmarking tools because file utilities report I/O throughput like real benchmarking tools and time taken can be easily measured. Therefore it might seem like there is no need to install a real benchmarking tool when file utilities are already available on every system.

Do not use cp(1), scp(1), or even dd(1). Instead, use a real benchmark like fio(1).

What's the difference? Real benchmarking tools can be configured to produce specific I/O patterns, like 4 KB random reads with queue depth 8, whereas file utilities offer limited or no ability to choose the I/O pattern. Since disk performance varies depending on the I/O pattern, it is hard to understand or compare results between systems without full control over the I/O pattern.

The second reason why real benchmarking tools are necessary is that file utilities are not designed to exercise the disk, they are designed to manipulate files. This means file utilities spend time doing things that does not involve disk I/O and therefore produces misleading performance results. The most important example of this is that file utilities use the operating system's page cache and this can result in no disk I/O activity at all!

2. Bypass the page cache

One of the most common mistakes is forgetting to bypass the operating system's page cache. Files and block devices opened with the O_DIRECT flag perform I/O to the disk without going through the page cache. This is the best way to guarantee that the disk actually gets I/O requests. Files opened without this flag are in "buffered I/O" mode and that means I/O may be fulfilled entirely within the page cache in RAM without any disk I/O activity. If the goal is to benchmark disk performance then the page cache needs to be eliminated.

fio(1) jobs must use the direct=1 parameter to exercise the disk.

It is not sufficient to echo 3 > /proc/sys/vm/drop_caches before running the benchmark instead of using O_DIRECT. Although this command is often used to make non-disk benchmarks produce more consistent results between runs, it does not guarantee that the disk will actually receive I/O requests. In addition, the page cache interferes with the desired benchmark I/O pattern since page cache prefetch and writeback will alter the actual I/O pattern that the disk sees.

3. Bypass file systems and device mapper

fio(1) can do both file I/O and disk I/O benchmarking, so it's often mistakenly used in file I/O mode instead of disk I/O mode. When benchmarking disk performance it is best to eliminate file systems and device mapper targets to isolate raw disk I/O performance. File systems and device mapper targets may have their own internal bottlenecks, such as software locks, that are unrelated to disk performance. File systems and device mapper targets are also likely to modify the I/O pattern because they submit their own metadata I/O.

fio(1) jobs must use the filename=/path/to/disk to do disk I/O benchmarking.

Without a block device filename parameter, the benchmark would create regular files on whatever file system is in use. Remember to double- and triple-check the block device filename before running benchmarks that write to the disk to avoid accidentally overwriting important data like the system root disk!

Example benchmark configurations

Here are a few example fio(1) jobs that you can use as a starting point.

High-throughput parallel reads

This job is a read-heavy workload with lots of parallelism that is likely to show off the device's best throughput:

[global]
filename=/path/to/device
runtime=120
ioengine=libaio
direct=1
ramp_time=10            # start measuring after warm-up time

[read]
readwrite=read
numjobs=16
blocksize=64k
offset_increment=128m   # each job starts at a different offset

Latency-sensitive random reads

This job is a latency-sensitive workload that stresses per-request overhead and seek times:

[global]
filename=/path/to/device
runtime=120
ioengine=libaio
direct=1
ramp_time=10            # start measuring after warm-up time

[read]
readwrite=randread
blocksize=4k

Mixed workload

This job simulates a more real-life workload with an I/O pattern that contains boths reads and writes:

[global]
filename=/path/to/device
runtime=120
ioengine=libaio
direct=1
ramp_time=10            # start measuring after warm-up time

[read]
readwrite=randrw
rwmixread=70
rwmixwrite=30
iodepth=4
blocksize=4k

Conclusion

There are several common issues with disk benchmarking that can lead to useless results. Using a real benchmarking tool and bypassing the page cache and file system are the basic requirements for useful disk benchmark results. If you have questions or suggestions about disk benchmarking, feel free to post a comment.
Saturday, July 29, 2017

Tracing userspace static probes with perf(1)

The perf(1) tool added support for userspace static probes in Linux 4.8. Userspace static probes are pre-defined trace points in userspace applications. Application developers add them so frequently needed lifecycle events are available for performance analysis, troubleshooting, and development.

Static userspace probes are more convenient than defining your own function probes from scratch. You can save time by using them and not worrying about where to add probes because that has already been done for you.

On my Fedora 26 machine the QEMU, gcc, and nodejs packages ship with static userspace probes. QEMU offers probes for vcpu events, disk I/O activity, device emulation, and more.

Without further ado, here is how to trace static userspace probes with perf(1)!

Scan the binary for static userspace probes

The perf(1) tool needs to scan the application's ELF binaries for static userspace probes and store the information in $HOME/.debug/usr/:

# perf buildid-cache --add /usr/bin/qemu-system-x86_64

List static userspace probes

Once the ELF binaries have been scanned you can list the probes as follows:

# perf list sdt_*:*

List of pre-defined events (to be used in -e):

  sdt_qemu:aio_co_schedule                           [SDT event]
  sdt_qemu:aio_co_schedule_bh_cb                     [SDT event]
  sdt_qemu:alsa_no_frames                            [SDT event]
  ...

Let's trace something!

First add probes for the events you are interested in:

# perf probe sdt_qemu:blk_co_preadv
Added new event:
  sdt_qemu:blk_co_preadv (on %blk_co_preadv in /usr/bin/qemu-system-x86_64)

You can now use it in all perf tools, such as:

 perf record -e sdt_qemu:blk_co_preadv -aR sleep 1

Then capture trace data as follows:

# perf record -a -e sdt_qemu:blk_co_preadv
^C
[ perf record: Woken up 3 times to write data ]
[ perf record: Captured and wrote 2.274 MB perf.data (4714 samples) ]

The trace can be printed using perf-script(1):

# perf script
 qemu-system-x86  3425 [000]  2183.218343: sdt_qemu:blk_co_preadv: (55d230272e4b) arg1=94361280966400 arg2=94361282838528 arg3=0 arg4=512 arg5=0
 qemu-system-x86  3425 [001]  2183.310712: sdt_qemu:blk_co_preadv: (55d230272e4b) arg1=94361280966400 arg2=94361282838528 arg3=0 arg4=512 arg5=0
 qemu-system-x86  3425 [001]  2183.310904: sdt_qemu:blk_co_preadv: (55d230272e4b) arg1=94361280966400 arg2=94361282838528 arg3=512 arg4=512 arg5=0
 ...

If you want to get fancy it's also possible to write trace analysis scripts with perf-script(1). That's a topic for another post but see the --gen-script= option to generate a skeleton script.

Current limitations

As of July 2017 there are a few limitations to be aware of:

Probe arguments are automatically numbered and do not have human-readable names. You will see arg1, arg2, etc and will need to reference the probe definition in the application source code to learn the meaning of the argument. Some versions of perf(1) may not even print arguments automatically since this feature was added later.

The contents of string arguments are not printed, only the memory address of the string.

Probes called from multiple call-sites in the application result in multiple perf probes. For example, if probe foo is called from 3 places you get sdt_myapp:foo, sdt_myapp:foo_1, and sdt_myapp:foo_2 when you run perf probe --add sdt_myapp:foo.

The SystemTap semaphores feature is not supported and such probes will not fire unless you manually set the semaphore inside your application or from another tool like GDB. This means that the sdt_myapp:foo will not fire if the application uses the MYAPP_FOO_ENABLED() macro like this: if (MYAPP_FOO_ENABLED()) MYAPP_FOO();.

Some history and alternative tools

Static userspace probes were popularized by DTrace's <sys/sdt.h> header. Tracers that came after DTrace implemented the same interface for compatibility.

On Linux the initial tool for static userspace probes was SystemTap. In fact, the <sys/sdt.h> header file on my Fedora 26 system is still part of the systemtap-sdt-devel package.

More recently the GDB debugger gained support for static userspace probes. See the Static Probe Points documentation if you want to use userspace static probes from GDB.

Conclusion

It's very handy to have static userspace probing available alongside all the other perf(1) tracing features. There are a few limitations to keep in mind but if your tracing workflow is based primarily around perf(1) then you can now begin using static userspace probes without relying on additional tools.

Thursday, July 13, 2017

Packet capture coming to AF_VSOCK

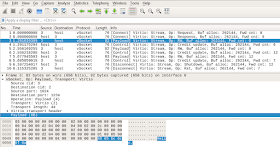
For anyone interested in the AF_VSOCK zero-configuration host<->guest communications channel it's important to be able to observe traffic. Packet capture is commonly used to troubleshoot network problems and debug networking applications. Up until now it hasn't been available for AF_VSOCK.

In 2016 Gerard Garcia created the vsockmon Linux driver that enables AF_VSOCK packet capture. During the course of his excellent Google Summer of Code work he also wrote patches for libpcap, tcpdump, and Wireshark.

Recently I revisited Gerard's work because Linux 4.12 shipped with the new vsockmon driver, making it possible to finalize the userspace support for AF_VSOCK packet capture. And it's working beautifully:

I have sent the latest patches to the tcpdump and Wireshark communities so AF_VSOCK can be supported out-of-the-box in the future. For now you can also find patches in my personal repositories:

The basic flow is as follows:

# ip link add type vsockmon
# ip link set vsockmon0 up
# tcpdump -i vsockmon0
# ip link set vsockmon0 down
# ip link del vsockmon0

It's easiest to wait for distros to package Linux 4.12 and future versions of libpcap, tcpdump, and Wireshark. If you decide to build from source, make sure to build libpcap first and then tcpdump or Wireshark. The libpcap dependency is necessary so that tcpdump/Wireshark can access AF_VSOCK traffic.

Monday, February 6, 2017

Slides posted for "Using NVDIMM under KVM" talk

I gave a talk on NVDIMM persistent memory at FOSDEM 2017. QEMU has gained support for emulated NVDIMMs and they can be used efficiently under KVM.

Applications inside the guest access the physical NVDIMM directly with native performance when properly configured. These devices are DDR4 RAM modules so the access times are much lower than solid state (SSD) drives. I'm looking forward to hardware coming onto the market because it will change storage and databases in a big way.

This talk covers what NVDIMM is, the programming model, and how it can be used under KVM. Slides are available here (PDF).

Update: Video is available here.