Thursday, April 30, 2020

How the Linux VFS, block layer, and device drivers fit together

The Linux kernel storage stack consists of several components including the Virtual File System (VFS) layer, the block layer, and device drivers. This article gives an overview of the main objects that a device driver interacts with and their relationships to each other. Actual I/O requests are not covered, instead the focus is on the objects representing the disk.

Let's start with a diagram of the key data structures and then an explanation of how they work together.

The Virtual File System (VFS) layer

The VFS layer is where file system concepts like files and directories are handled. The VFS provides an interface that file systems like ext4, XFS, and NFS implement to register themselves with the kernel and participate in file system operations. The struct file_operations interface is the most interesting for device drivers as we are about to see.

System calls like open(2), read(2), etc are handled by the VFS and dispatched to the appropriate struct file_operations functions.

Block device nodes like /dev/sda are implemented in fs/block_dev.c, which forms a bridge between the VFS and the Linux block layer. The block layer handles the actual I/O requests and is aware of disk-specific information like capacity and block size.

The main VFS concept that device drivers need to be aware of is struct block_device_operations and the struct block_device instances that represent block devices in Linux. A struct block_device connects the VFS inode and struct file_operations interface with the block layer struct gendisk and struct request_queue.

In Linux there are separate device nodes for the whole device (/dev/sda) and its partitions (/dev/sda1, /dev/sda2, etc). This is handled by struct block_device so that a partition has a pointer to its parent in bd_contains.

The block layer

The block layer handles I/O request queues, disk partitions, and other disk-specific functionality. Each disk is represented by a struct gendisk and may have multiple struct hd_struct partitions. There is always part0, a special "partition" covering the entire block device.

I/O requests are placed into queues for processing. Requests can be merged and scheduled by the block layer. Ultimately a device driver receives a request for submission to the physical device. Queues are represented by struct request_queue.

The device driver

The disk device driver registers a struct genhd with the block layer and sets up the struct request_queue to receive requests that need to be submitted to the physical device.

There is one struct genhd for the entire device even though userspace may open struct block_device instances for multiple partitions on the disk. Disk partitions are not visible at the driver level because I/O requests have already had their Logical Block Address (LBA) adjusted with the partition start offset.

How it all fits together

The VFS is aware of the block layer struct gendisk. The device driver is aware of both the block layer and the VFS struct block_device. The block layer does not have direct connections to the other components but the device driver provides callbacks.

One of the interesting aspects is that a device driver may drop its reference to struct gendisk but struct block_device instances may still have their references. In this case no I/O can occur anymore because the driver has stopped the disk and the struct request_queue, but userspace processes can still call into the VFS and struct block_device_operations callbacks in the device driver can still be invoked.

Thinking about this case is why I drew the diagram and ended up writing about this topic!

Monday, April 20, 2020

virtio-fs has landed in QEMU 5.0!

The virtio-fs shared host<->guest file system has landed in QEMU 5.0! It consists of two parts: the QEMU -device vhost-user-fs-pci and the actual file server called virtiofsd. Guests need to have a virtio-fs driver in order to access shared file systems. In Linux the driver is called virtiofs.ko and has been upstream since Linux v5.4.

Using virtio-fs

Thanks to libvirt virtio-fs support, it's possible to share directories trees from the host with the guest like this:

<filesystem type='mount' accessmode='passthrough'>
    <driver type='virtiofs'/>
    <binary xattr='on'>
       <lock posix='on' flock='on'/>
    </binary>
    <source dir='/path/on/host'/>
    <target dir='mount_tag'/>
</filesystem>

The host /path/on/host directory tree can be mounted inside the guest like this:

# mount -t virtiofs mount_tag /mnt

Applications inside the guest can then access the files as if they were local files. For more information about virtio-fs, see the project website.

How it works

For the most part, -device vhost-user-fs-pci just facilitates the connection to virtiofsd where the real work happens. When guests submit file system requests they are handled directly by the virtiofsd process on the host and don't need to go via the QEMU process.

virtiofsd is a FUSE file system daemon with virtio-fs extensions. virtio-fs is built on top of the FUSE protocol and therefore supports the POSIX file system semantics that applications expect from a native Linux file system. The Linux guest driver shares a lot of code with the traditional fuse.ko kernel module.

Resources on virtio-fs

I have given a few presentations on virtio-fs:

Future features

A key feature of virtio-fs is the ability to directly access the host page cache, eliminating the need to copy file contents into guest RAM. This so-called DAX support is not upstream yet.

Live migration is not yet implemented. It is a little challenging to transfer all file system state to the destination host and seamlessly continue file system operation without remounting, but it should be doable.

There is a Rust implementation of virtiofsd that is close to reaching maturity and will replace the C implementation. The advantage is that Rust has better memory and thread safety than C so entire classes of bugs can be eliminated. Also, the codebase is written from scratch whereas the C implementation was a combination of several existing pieces of software that were not designed together.

Saturday, February 15, 2020

An introduction to GDB scripting in Python

Sometimes it's not humanly possible to inspect or modify data structures manually in a debugger because they are too large or complex to navigate. Think of a linked list with hundreds of elements, one of which you need to locate. Finding the needle in the haystack is only possible by scripting the debugger to automate repetitive steps.

This article gives an overview of the GNU Debugger's Python scripting support so that you can tackle debugging tasks that are not possible manually.

What scripting GDB in Python can do

GDB can load Python scripts to automate debugging tasks and to extend debugger functionality. I will focus mostly on automating debugging tasks but extending the debugger is very powerful though rarely used.

Say you want to search a linked list for a particular node:

(gdb) p node.next
...
(gdb) p node.next.next
...
(gdb) p node.next.next.next

Doing this manually can be impossible for lists with too many elements. GDB scripting support allows this task to be automated by writing a script that executes debugger commands and interprets the results.

Loading Python scripts

The source GDB command executes files ending with the .py extension in a Python interpreter. The interpreter has access to the gdb Python module that exposes debugging APIs so your script can control GDB.

$ cat my-script.py
print('Hi from Python, this is GDB {}'.format(gdb.VERSION))
$ gdb
(gdb) source my-script.py
Hi from Python, this is GDB Fedora 8.3.50.20190824-28.fc31

Notice that the gdb module is already imported. See the GDB Python API documentation for full details of this module.

It's also possible to run ad-hoc Python commands from the GDB prompt:

(gdb) py print('Hi')
Hi

Executing commands

GDB commands are executed using gdb.execute(command, from_tty, to_string). For example, gdb.execute('step') runs the step command. Output can be collected as a Python string by setting to_string to True. By default output goes to the interactive GDB session.

Although gdb.execute() is fundamental to GDB scripting, at best it allows screen-scraping (interpreting the output string) rather than a Pythonic way of controlling GDB. There is actually a full Python API that represents the debugged program's types and values in Python. Most scripts will use this API instead of simply executing GDB commands as if simulating an interactive shell session.

Navigating program variables

The entry point to navigating program variables is gdb.parse_and_eval(expression). It returns a gdb.Value.

When a gdb.Value is a struct its fields can be indexed using value['field1']['child_field1'] syntax. The following example iterates a linked list:

elem = gdb.parse_and_eval('block_backends.tqh_first')
while elem:
    name = elem['name'].string()
    if name == 'drive2':
        print('Found {}'.format(elem['dev']))
        break
    elem = elem['link']['tqe_next']

This script iterates the block_backends linked list and checks the name field of each element against "drive2". When it finds "drive2" it prints the dev field of that element.

There is a lot more that GDB Python scripts can do but you'll have to check out the API documentation to learn about it.

Conclusion

Python scripts can automate tedious debugging tasks in GDB. Having the full power of Python and access to file I/O, HTTP requests, etc means pretty much any debugging task can be turned into a full-blown program. A subset of this was possible in the past through GDB command scripts, but Python is a much more flexible programming language and familiar to many developers (more so than GDB's own looping and logic commands!).

Monday, February 10, 2020

Video for "virtio-fs: a shared file system for virtual machines" at FOSDEM '20 now available

The video and slides from my virtio-fs talk at FOSDEM '20 are now available!

virtio-fs is a shared file system that lets guests access a directory on the host. It can be used for many things, including secure containers, booting from a root directory, and testing code inside a guest.

The talk explains how virtio-fs works, including the Linux FUSE protocol that it's based on and how FUSE concepts are mapped to VIRTIO.

virtio-fs guest drivers have been available since Linux v5.4 and QEMU support will be available from QEMU v5.0 onwards.

Video (webm) (mp4)

Slides (PDF)

Sunday, February 9, 2020

Why CPU Utilization Metrics are Confusing

How much CPU is being used? Intuitively we would like to know the percentage of time being consumed. Popular utilities like top(1) and virt-top(1) do show percentages but the numbers can be weird. This post goes into how CPU utilization is accounted and why the numbers can be confusing.

Tools sometimes show CPU utilizations above 100%. Or we know a virtual machine is consuming all its CPU but only 12% CPU utilization is reported. Comparing CPU utilization metrics from different tools often reveals that the numbers they report are wildly different. What's going on?

How CPU Utilization is Measured

Imagine we want to measure the CPU utilization of an application on a simple computer with one CPU. Each time the application is scheduled on the CPU we record the time until it is next descheduled. The utilization is calculated by dividing the total CPU time that the application ran by the time interval being measured:

Here t is execution time for each of the n times the application was scheduled and T is the time unit being measured (e.g. 1 second).

So far, so good. This is how CPU utilization times should work. Now let's look at why the percentages can be confusing.

CPU Utilization on Multi-Processor Systems

Modern computers from mobile phones to laptops to servers typically have multiple logical CPUs. They are called logical CPUs because they appear as a CPU to software regardless of whether they are implemented as a socket, a core, or an SMT hardware thread.

On multi-processor systems we need to adapt the CPU utilization formula to account for CPUs running in parallel. There are two ways to do this:

  1. Treat 100% as full utilization of all CPUs. top(1) calls this Solaris mode.
  2. Treat 100% as full utilization of one CPU. top(1) calls this Irix mode.

By default top(1) reports CPU utilization in Irix mode and virt-top(1) reports Solaris mode.

The implications of Solaris mode are that a single CPU being fully utilized is only reported as 1/N CPU utilization where N is the number of CPUs. On a system with a large number of CPUs the utilization percentages can be very low even though some CPUs are fully utilized. Even on my laptop with 4 logical CPUs that means a single-threaded application consuming a full CPU only reports 25% CPU utilization.

Irix mode produces more intuitive 0-100% numbers for single-threaded applications but multi-threaded applications may consume multiple CPUs and therefore exceed 100%, which looks a bit funny.

Confused?

Since there are two ways of accounting CPU utilization on multi-processor systems it is always necessary to know which method is being used. A percentage on its own is meaningless and might be misinterpreted.

This also explains why numbers reported by different tools can be so vastly different. It is necessary to check which accounting method is being used by both tools.

Documentation (and source code) often sheds light on which accounting method is used, but another way to check is by running a process that consumes a full CPU and then observing the CPU utilization that is reported. This can be done by running while true; do true; done in a shell and checking the CPU utilization numbers that are reported.

virt-top(1) has another peculiarity that must be taken into account. Its formula divides CPU time consumed by a guest by the total CPU time available on the host. If the guest has 4 vCPUs but the guest has 8 physical CPUs, then the guest can only ever reach 50% because it will never use all physical CPUs at once.

Conclusion

CPU utilization can be confusing on multi-processor systems, which is most computers today. Interpreting CPU utilization metrics requires knowing whether Solaris mode or Irix mode was used for calculation. Be careful with CPU utilization metrics!

Friday, February 7, 2020

Apply for QEMU Outreachy 2020 May-August internships now!

QEMU is participating in the Outreachy open source internship program again this year. Check out the QEMU blog for more information about this 12-week full-time, paid, remote work internship working on QEMU.

Friday, November 29, 2019

Visiting the Centre for Computing History

I visited the Centre for Computing History today in Cambridge, UK. It's home to old machines from computer science history, 80s home computers, 90s games consoles, and much more. It was nice to see familiar machines that I used to play with back in the day. This post has pictures from the visit to the museum.

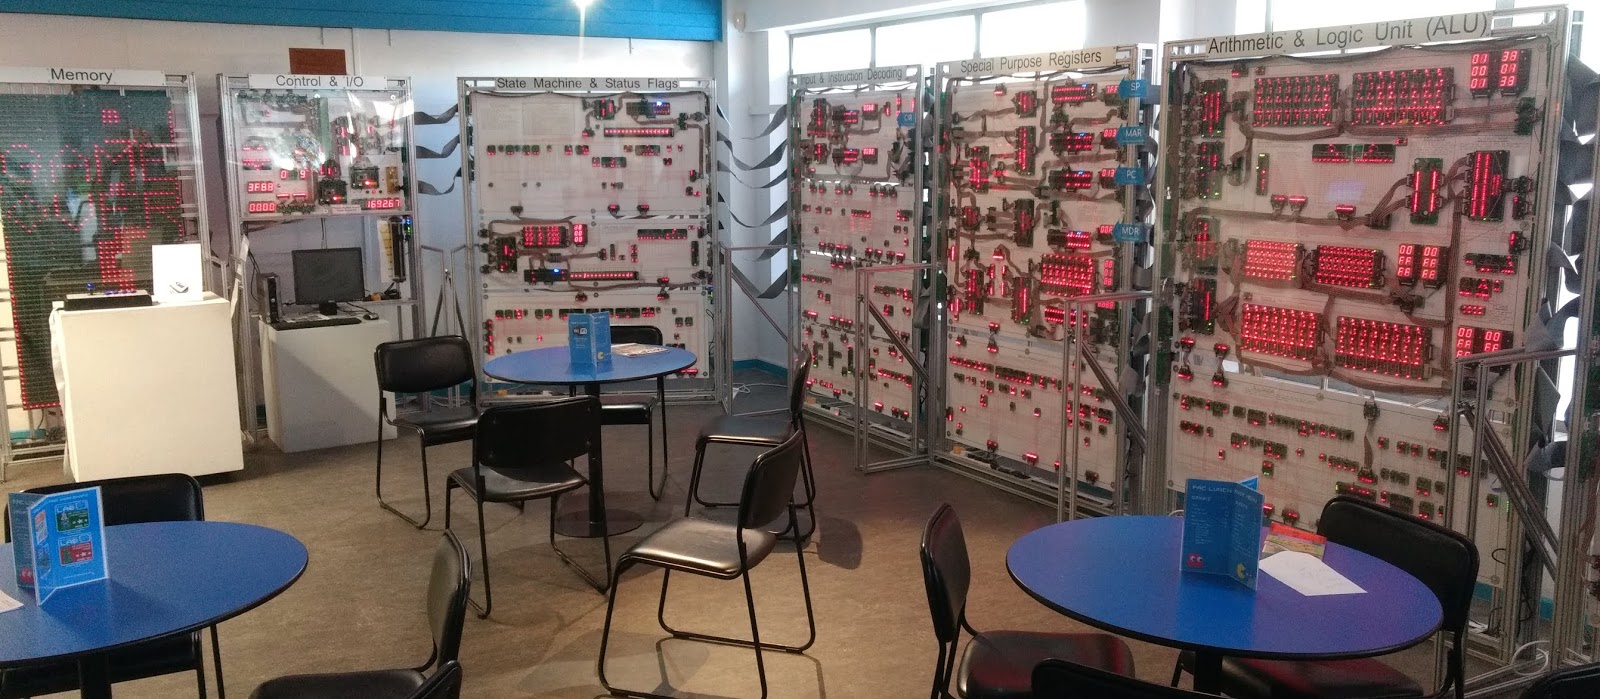
The journey starts with the Megaprocessor, a computer build from 15,000 transistors with countless LEDs that allow you to see what's happening inside the machine while a program runs.

The Megaprocessor has its own instruction set architecture (ISA) with 4 General Purpose Registers (GPRs). The contents of the GPRs are visible on seven-segment displays and LEDs.

The instruction decoder looks fun. Although I didn't look in detail, it seems to be an old-school decoder where each bit in an instruction is hardcoded to enable or disable certain hardware units. No microcoded instructions here!

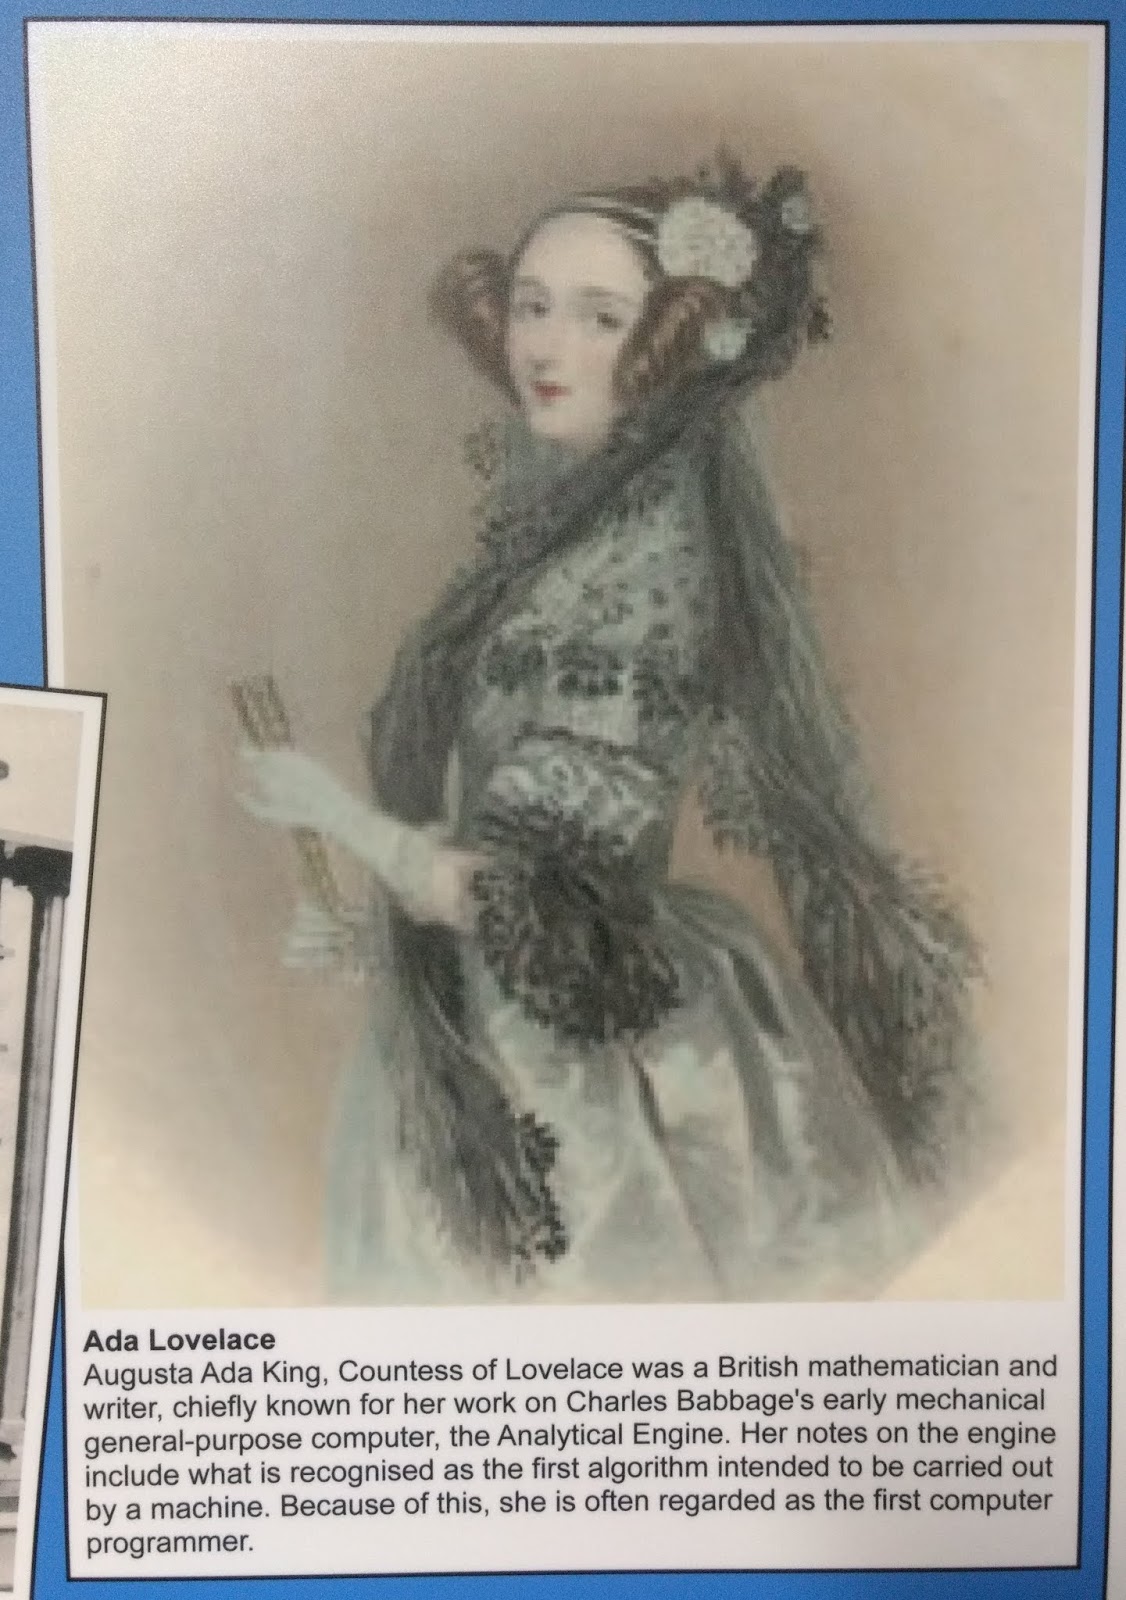
Ada Lovelace is considered the first programmer thanks to her work on the Analytical Engine. On a Women in Computer Science note, I learnt that Margaret Hamilton coined the term "software engineering". Hedy Lamarr also has an interesting background: movie star and inventor. There are posters throughout the museum featuring profiles on women in computer science that are quite interesting.

The museum is very hands-on with machines available to use and other items like books open to visitors. If nostalgia strikes and you want to sit down and play a game or program in BASIC, or just explore an exotic old machine, you can just do it! That is quite rare for a museum since these are historic items that can be fragile or temperamental.

Moving along in chronological order, here is the PDP-11 minicomputer that UNIX ran on in 1970! I've seen them in museums before have yet to interact with one.

In the 1980s the MicroVAX ran VMS or ULTRIX. I've read about these machines but they were before my time! It's cool to see one.

This HP Graphics Terminal was amusing. I don't see anything graphical about ASCII art, but I think the machine was connected to a plotter/printer.

The museum has a lot of microcomputers from the 1980s including brands I've never heard of. There were also machines with laserdiscs or more obscure optical media, what eventually became the "multi-media" buzzword in the 90s when CD-ROMs became mainstream.

Speaking of optical media, here is an physical example of bitrot, the deterioration of data media or software!

Classic home computers: ZX Spectrum, Commodore 64, Atari ST Mega 2, and Acorn. The museum has machines that were popular in the UK, so the selection is a little different from what you find in the Computer History Museum in Mountain View, CA, USA.

There are games consoles from the 80s, 90s, and 2000s. The Gameboy holds a special place for me. Both the feel of the buttons and the look of the display still seems right in this age of high resolution color displays.

The museum has both the popular Nintendo, SEGA, and Sony consoles as well as rarer specimens that I've never seen in real life before. It was cool to see an Intellivision, Jaguar, etc.

Back to UNIX. This SGI Indy brought back memories. I remember getting a used one in order to play with the IRIX operating system. It was already an outdated machine at the time but the high resolution graphics and the camera were clearly ahead of its time.

Say hello to an old friend. I remember having exactly the same 56K modem! What a wonderful dial-up sound :).

And finally, the Palm pilot. Too bad that the company failed, they had neat hardware before smartphones came along. I remember programming and reverse engineering on the Palm.

Conclusion

If you visit Cambridge, UK be sure to check out the Centre for Computing History. It has an excellent collection of home computers and games consoles. I hope it will be expanded to cover the 2000s internet era too (old web browsers, big websites that no longer exist, early media streaming, etc).